Code Profiling
Until yesterday, if anyone asked me about dynamic code profiling, I would have said that the only way to do it is to buy the Red Gate ANTS Profiler or the Jet Brains dotTrace Profiler.
Little did I know that I already had an excellent profiling tool installed right there on my machine for the last couple of years!
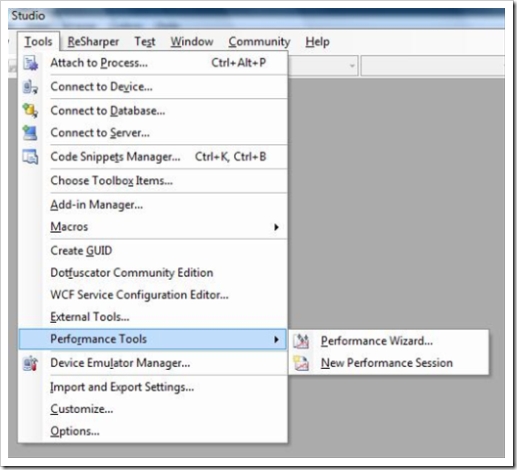
So what am I talking about. It's the small menu option that you see under Tools called Performance. Aha so that's why I never knew about this all along. The VSTS most probably wanted this to be an easter egg!
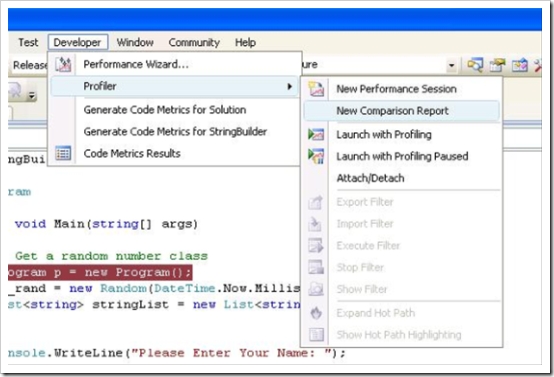
No worries though Orcas is going to fix this by renaming it to Profiler and moving it under the new Developer menu.
No wonder that this rarely shows up on Live Search or Google. The keyword profiler is nowhere to be found even in the overview page of this feature on MSDN.
So what can you do with the profiler today? Well you can use it to make your .NET applications super-duper fast. You'll find out things like which method gets called the most and which method takes most of the time to execute and a whole number of other things.


